Last week I shared the first part of a presentation I gave at an ITE Western District Conference. I released the first half of my presentation last and this is the second article in this two part series.
6. Parking Data
- Parking Lots. We’ve had several projects where we install cameras at all of the access points to a campus. We count the vehicles entering and exiting from midnight to midnight to get the trend line of vehicle occupancy in the site. We either assume no vehicles parked at midnight or we’ll do an onsite count at a certain point of the day. Either way, we can closely approximate the vehicles parked within the campus by entering the data in a spreadsheet and summing the traffic over time.
- On Street. Approximately 300 feet of a block can be viewed with a single camera. A block’s parking turnover and occupancy rates can be recorded on fast forward speed watching the videos.
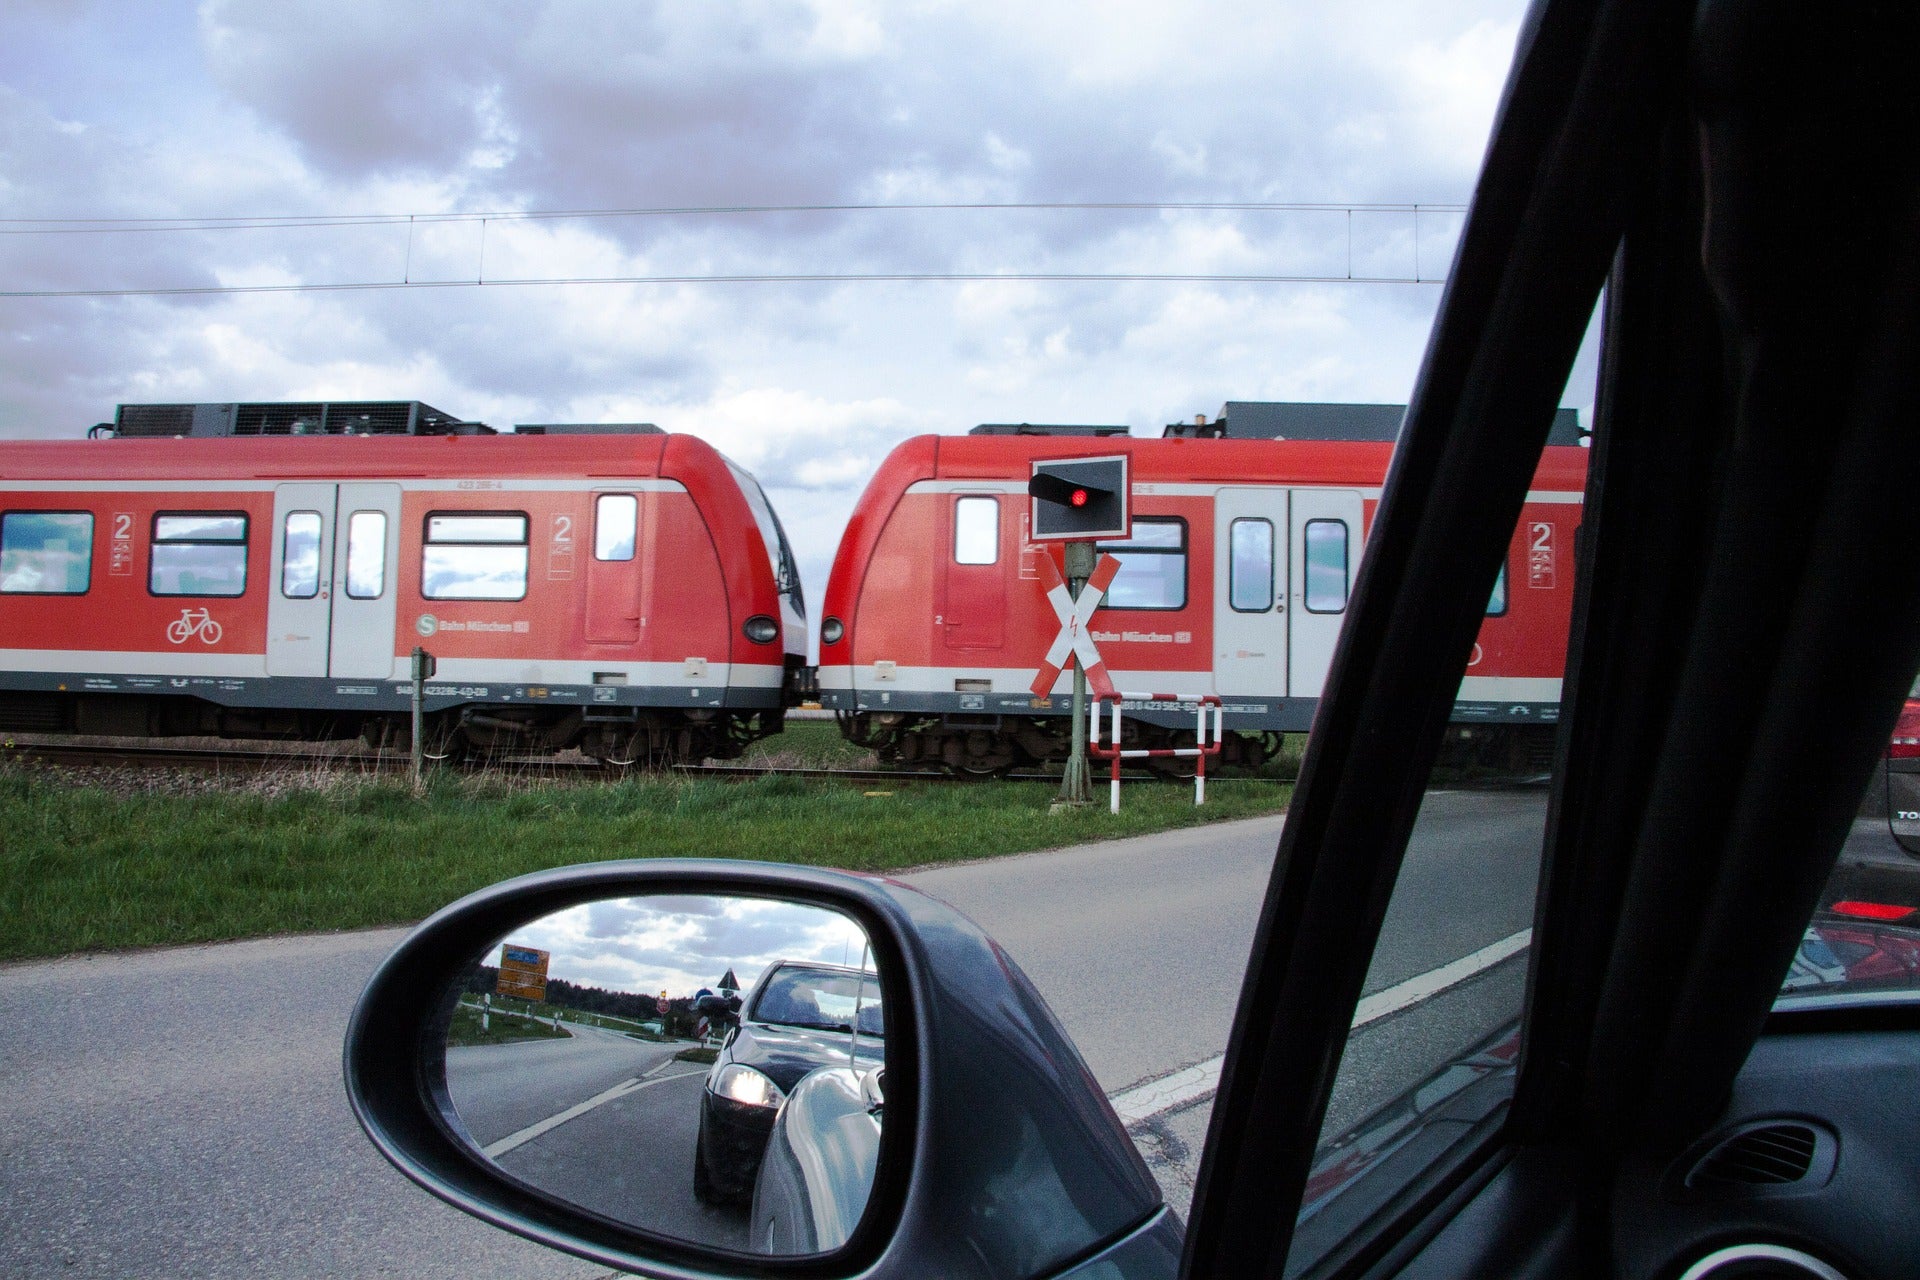
 7. Train Data. Our experience in Minnesota is that train companies will not share data about their track usage. It’s a matter of Homeland Security. We’ve had four projects in the last two years where we recorded multiple days at railroad track crossings. The videos were scrolled through and we recorded the time the crossing began, the time the crossing ended, and the number of cars in the train. This data was important for several environmental documents and traffic models.
8. Pedestrian & Bicycle Data
- Effectiveness of Rapid Flashing Beacon: The City of Maple Grove upgraded a pedestrian crossing on a four lane undivided road near a park to have a pedestrian actuated Rapid Flashing Beacon crossing system. We collected before and after video, breaking pedestrian crossing events into categories depending on whether vehicles yielded to the pedestrians or not. We found little difference with the new system because 95% of the pedestrians didn’t push the button to turn on the flashers.
- Crossing data in St. Louis Park: We recorded approximately twenty uncontrolled pedestrian crossings in the city and counted multiple days of pedestrian crossings. The city used this data to determine where to place on-street pedestrian crossing signs.
9. Public Hearings. If a picture says a thousand words, a video may just say a million. Short clips of intersection operations have proven to be very helpful in presentations.
10. Run Experiments
- Traffic Calming. Minneapolis pioneered testing temporary traffic calming in neighborhoods about twenty years ago and most jurisdictions in Minnesota will now test out a concept before making a permanent installation. This can be done using barrels to build a traffic circle or using temporary rubber speed humps. Collecting before/after video allows the engineer to collect data related to the effectiveness of the treatments as well as get a firsthand view of how they are operating.
- Bicycle Treatments. Minneapolis has also implemented a very aggressive plan to implement bicycle friendly measures which have propelled the city to being one of the best bicycling cities in the country even though we have a northern climate. Minneapolis engineers regularly collect videos at temporary bicycle treatments, such as bump outs and temporary on street bike lanes, to see how they work before building a final design.
- School Parking. De La Salle High School is located on a restricted site on Nicollet Island in the Mississippi River on the edge of downtown Minneapolis. They are under-parked with 110 stalls for staff and 750 high school students. The 115 year old school brought us in to see if we could improve their parking system. Short of building a parking ramp, we couldn’t make huge capacity gains. We did come up with a concept that converted the parking flow into a one-way system through their site and moved the pick-up drop-off zone to a side of the building. The current operations had an aisle that was used for bus parking, pick-up drop-off, and students had to cross this aisle to get to the parking lot. Not good. Our recommendations potentially improved safety on site and also allowed for parallel parking along the drive aisle, increasing parking about 10%. The changes in flow were made with orange cones and a publicity campaign. We videoed four key intersections for a week. We were concerned about queues spilling out onto the arterial road that crosses the Mississippi River. We found minimal queueing and impact to a small residential neighborhood north of the school.
Have you used video as part of your traffic data collection process? I would love to hear about your experiences and how video has impacted your work.
Read the first part of the article by clicking on Top 10 Ways Video Data Collection is Improving My Engineering – Part 1.